At the point where total revenues and total cost becomes equal, this phenomenon is known as Break-even analysis. With the help of it, companies determine the level of appropriate sales price needed that could cover its relevant fixed cost. Break-even point examines and calculate the needed safety margin based on associated cost and collected revenues. On the other hand, break-even analysis provide the situation where organizations are neither losing money nor earning any profit, but rather recovering its sacrificed cost only. In addition to this, it is widely used as a decision-making tool which assist entrepreneur to analyze the viability of new startups or ideas in the existing market.
Break-Even Analysis Formula in Units and In Sales
In This Article
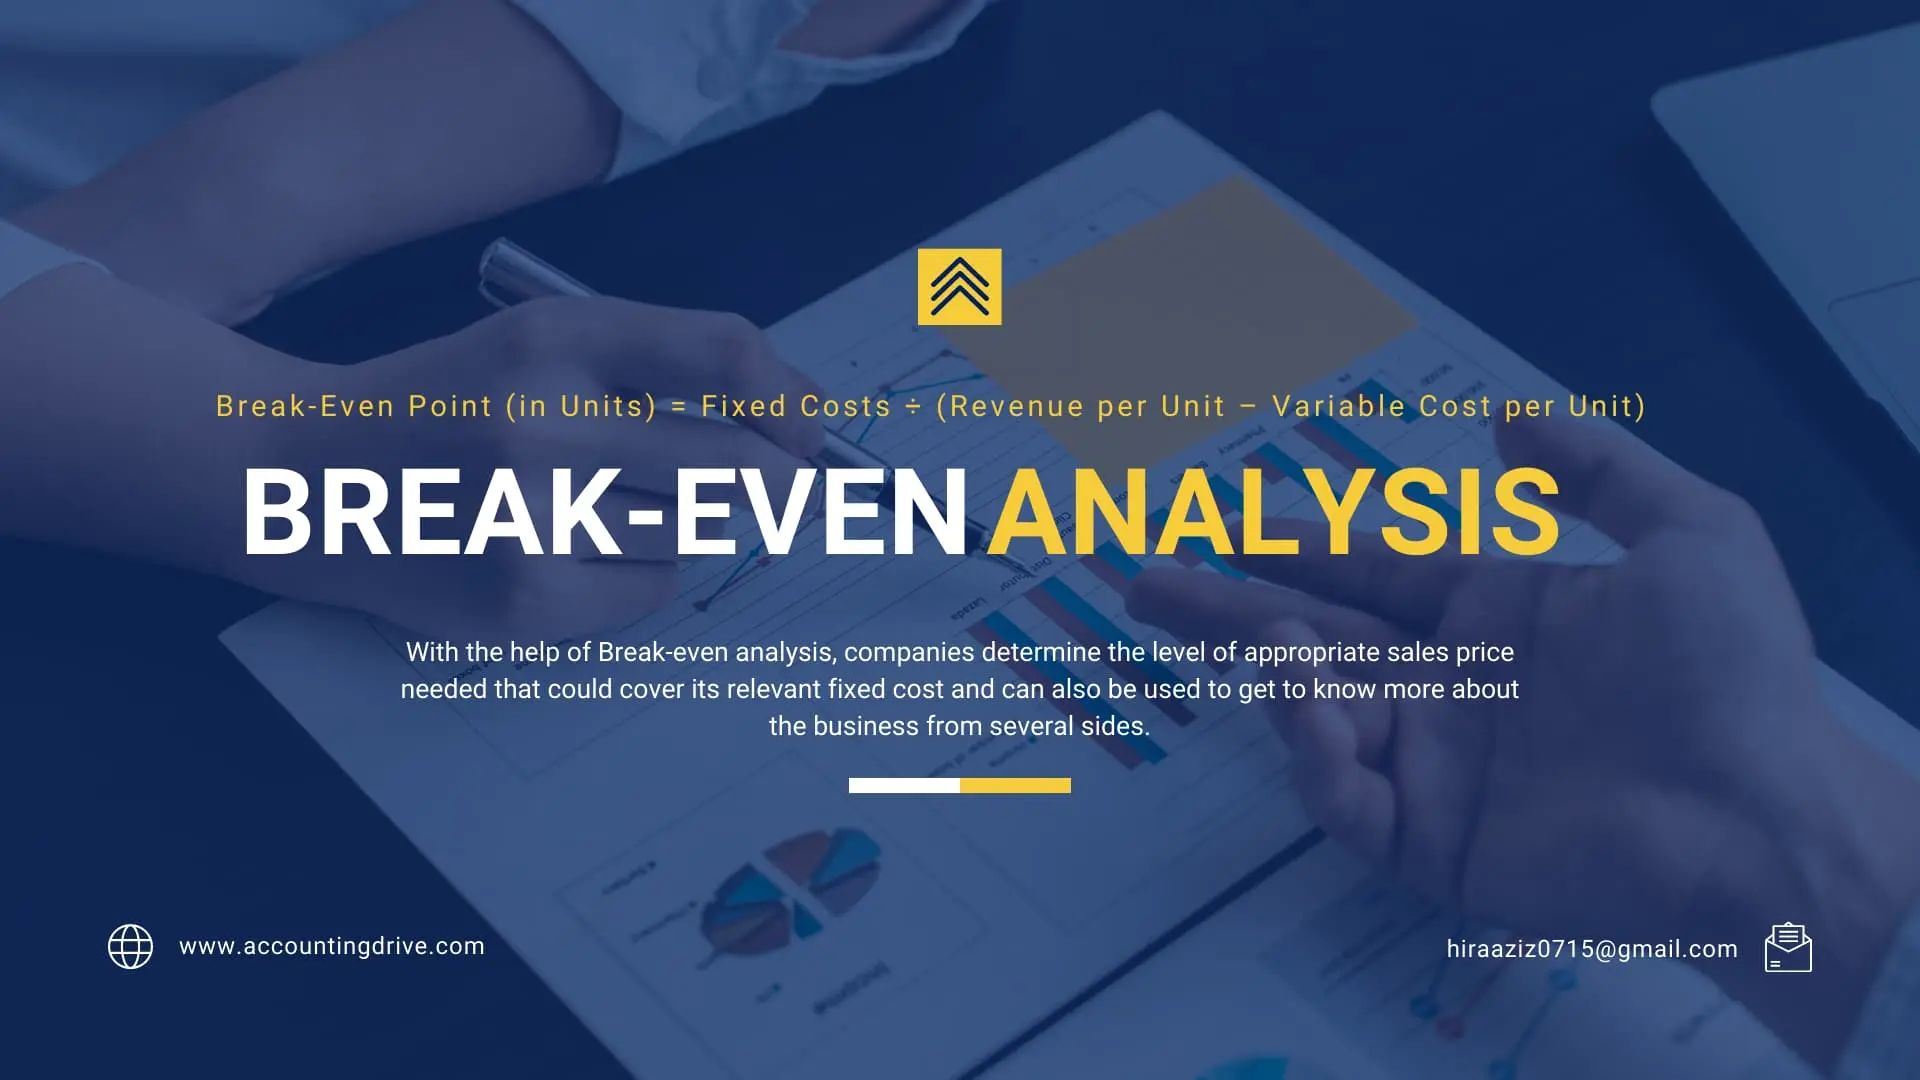
ToggleBreak-Even Point (in Units) = Fixed Costs ÷ (Revenue per Unit – Variable Cost per Unit)
Break-Even Point (in dollars) = Fixed Costs ÷ Contribution Margin
Contribution Margin per unit = Price of Product – Variable Costs
Contribution Margin Ratio = Contribution Margin per unit/ Sales Price
Components of Break-Even Analysis
- Variable Cost
- Fixed cost
- Revenue
- Contribution Margin
- Break-Even Point
Components of Break-Even Analysis are:
- Variable Cost: Variable cost is the cost which changes with the change in the business activity or production output. It varies with the change in the total production quantity. If, the production output is zero, the variable cost will also be zero. The examples of variable cost includes the wages, sales commission, packaging cost, or the raw material.
- Fixed Cost: Unlike variable costs, fixed cost remains same and unchanged with the increase in production output. The per unit cost may varies with the change in production quantity. Fixed costs do not affect by any temporary change in the business activity. Its example includes salary, lease, depreciation, and rent.
- Revenue: Revenue is the total amount or a total income company generates by selling goods or services. It includes fixed as well as variable cost and a profit margin.
- Contribution Margin: Contribution Margin is the amount difference between selling price and its variable cost.
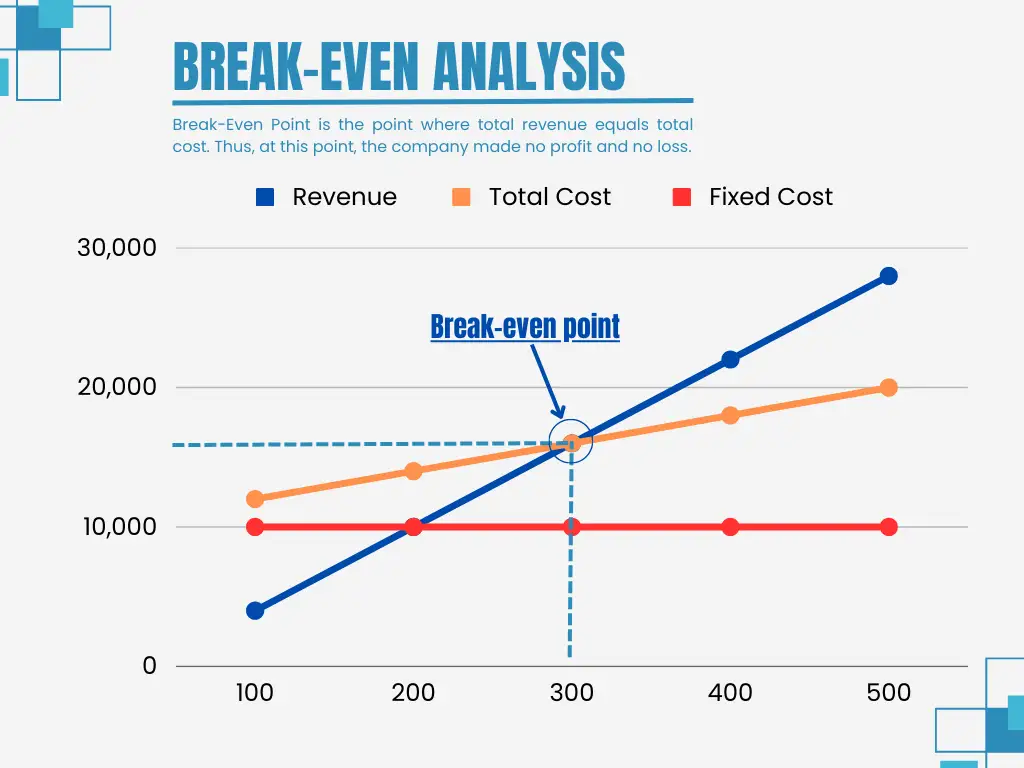
- Break-Even Point: Break-Even Point is the point where total revenue equals total cost. Thus, at this point, company made no profit no loss.
Example
Numerical Data
ABC Company sells water bottles with the sales price of $53 per unit. The fixed costs are $10,000, and the variable cost for each unit is $20. The company wants to determine the unit sold to recover its cost.
Calculation of Break-Even Point in Units and In Sales
Contribution Margin per unit = ($53- $20) = $33
Break-Even Point (in Units) = $10,000/ ($53- $20) = 303 units
Contribution Margin Ratio = $33/ $53 = 62.3%
Break-Even Point (in dollars) = $10,000/ 62.3% = $16,051
Graphical Representation
Benefits of Break-Even Analysis
Break-even analysis provides a deep insight about the viability of the company’s sales. It helps in decision making. The benefits of break-even analysis have been discussed in detail below:
- With the help of it, the sales manager and sale team will become able to identify: how to increase profitability, how much units should be sold and will eventually formulate sales goals based on the analysis.
- In order to increase outside funding or to utilize other financing options, your plan should be backed by strong analyzing calculations to represent viable returns and strong profitability. Break-even analysis provides strong basis and facts for effective decision making.
- With the help of this technique, companies can recover their fixed costs and to determine the safety margin. Safety margin helps to recover cost from the unit sold.
- Organizations can determine the better product price which could maximize profits for the companies.
- In addition to this, this analysis helps entrepreneurs to analyze the viability of the new start-ups and its associated risk level.
Limitations of Break-Even Analysis
Break-even analysis provides with many advantages such as easy calculations and strong decision-making power, but it entails some limitation as well which has been discussed in detail below:
- It is unrealistic to consider that all production output will sale and will not entail some wasted or build up output.
- When output changes, the fixed cost also vary. It is unrealistic to consider that products at different price level could not sale at same price level.
- Moreover, Variable cost also varies or increases as the output production level increases. Because organizations can buy at lower prices when they purchase inputs in bulk quantity or because of good supplier relationships.
- Break-even analysis is considered as a good one decision-making tool, but it should consider as planning aid only because of unviable consequences.
- When an organization has a wide product portfolio or sells more than one product, it would become difficult to perform this analysis.
Key Points
- Break-even point is the point where total cost equals total revenue.
- TOTAL REVENUE =TOTAL COST
- At this point, company earns no revenue no loss.
- So, here company only covers its relevant cost.