𝐀𝐧𝐚𝐥𝐲𝐳𝐞 𝐘𝐨𝐮𝐫 𝐋𝐢𝐪𝐮𝐢𝐝𝐢𝐭𝐲: 𝟓 𝐁𝐞𝐬𝐭 𝐂𝐚𝐬𝐡 𝐅𝐥𝐨𝐰 𝐀𝐧𝐚𝐥𝐲𝐬𝐢𝐬 𝐑𝐚𝐭𝐢𝐨𝐬
In This Article
ToggleCash flow analysis ratios…. Wow! something very interesting. Cash flow analysis ratios are a very effective tool for comparing cash inflows and outflows from all financial statements. They provide more accurate liquidity analysis as compared to the balance sheet and income statement liquidity analysis.

- Using cash flow ratios, a company seeks out how much cash it has, where its cash is going, and what it needs to do to maintain and support a balanced budget!
What Do Basic Cash flow Ratios Indicate?
You must know that every business prosperity is the ability to make a profit, continuously, year after year. So, you should be well aware that obtaining and applying the information from cash flow ratios is important for a profitable business.
Let’s first understand the basics of the cash flow statement. So, the cash flows statement consists of three main parts:
- Operating cash flows
- Investing cash flows
- Financing cash flows
Here, you can calculate the operating cash flows by having a trend of growth and decline in the current asset and liability accounts over a while time. While financing cash flows are the outcome/return of funding to the business. Moreover, Investing cash flows come from investing activities of the organization like financial securities, property, plant & equipment.

Thus, you can analyze the above three forms of cash flows, along with the balance sheet and income statement data. To sum up, it may provide you the valuable information that can be useful for financial analysis of the organization’s cash position.
Five Cash Flow Ratios to Analyze Cash Flow Statement
Cash Flow Analysis Ratios Formulas
1. Cash Flow Margin Ratio
You may calculate it as cash flow from operations divided by sales. It gives a more reliable picture than net profit, as it shows the exact amount of cash generated per dollar of sales. Hence, the cash flow margin indicates how efficiently and effectively a company converts its sales into cash. As expenses and purchases are paid by cash, therefore this is a crucial profitability ratio.
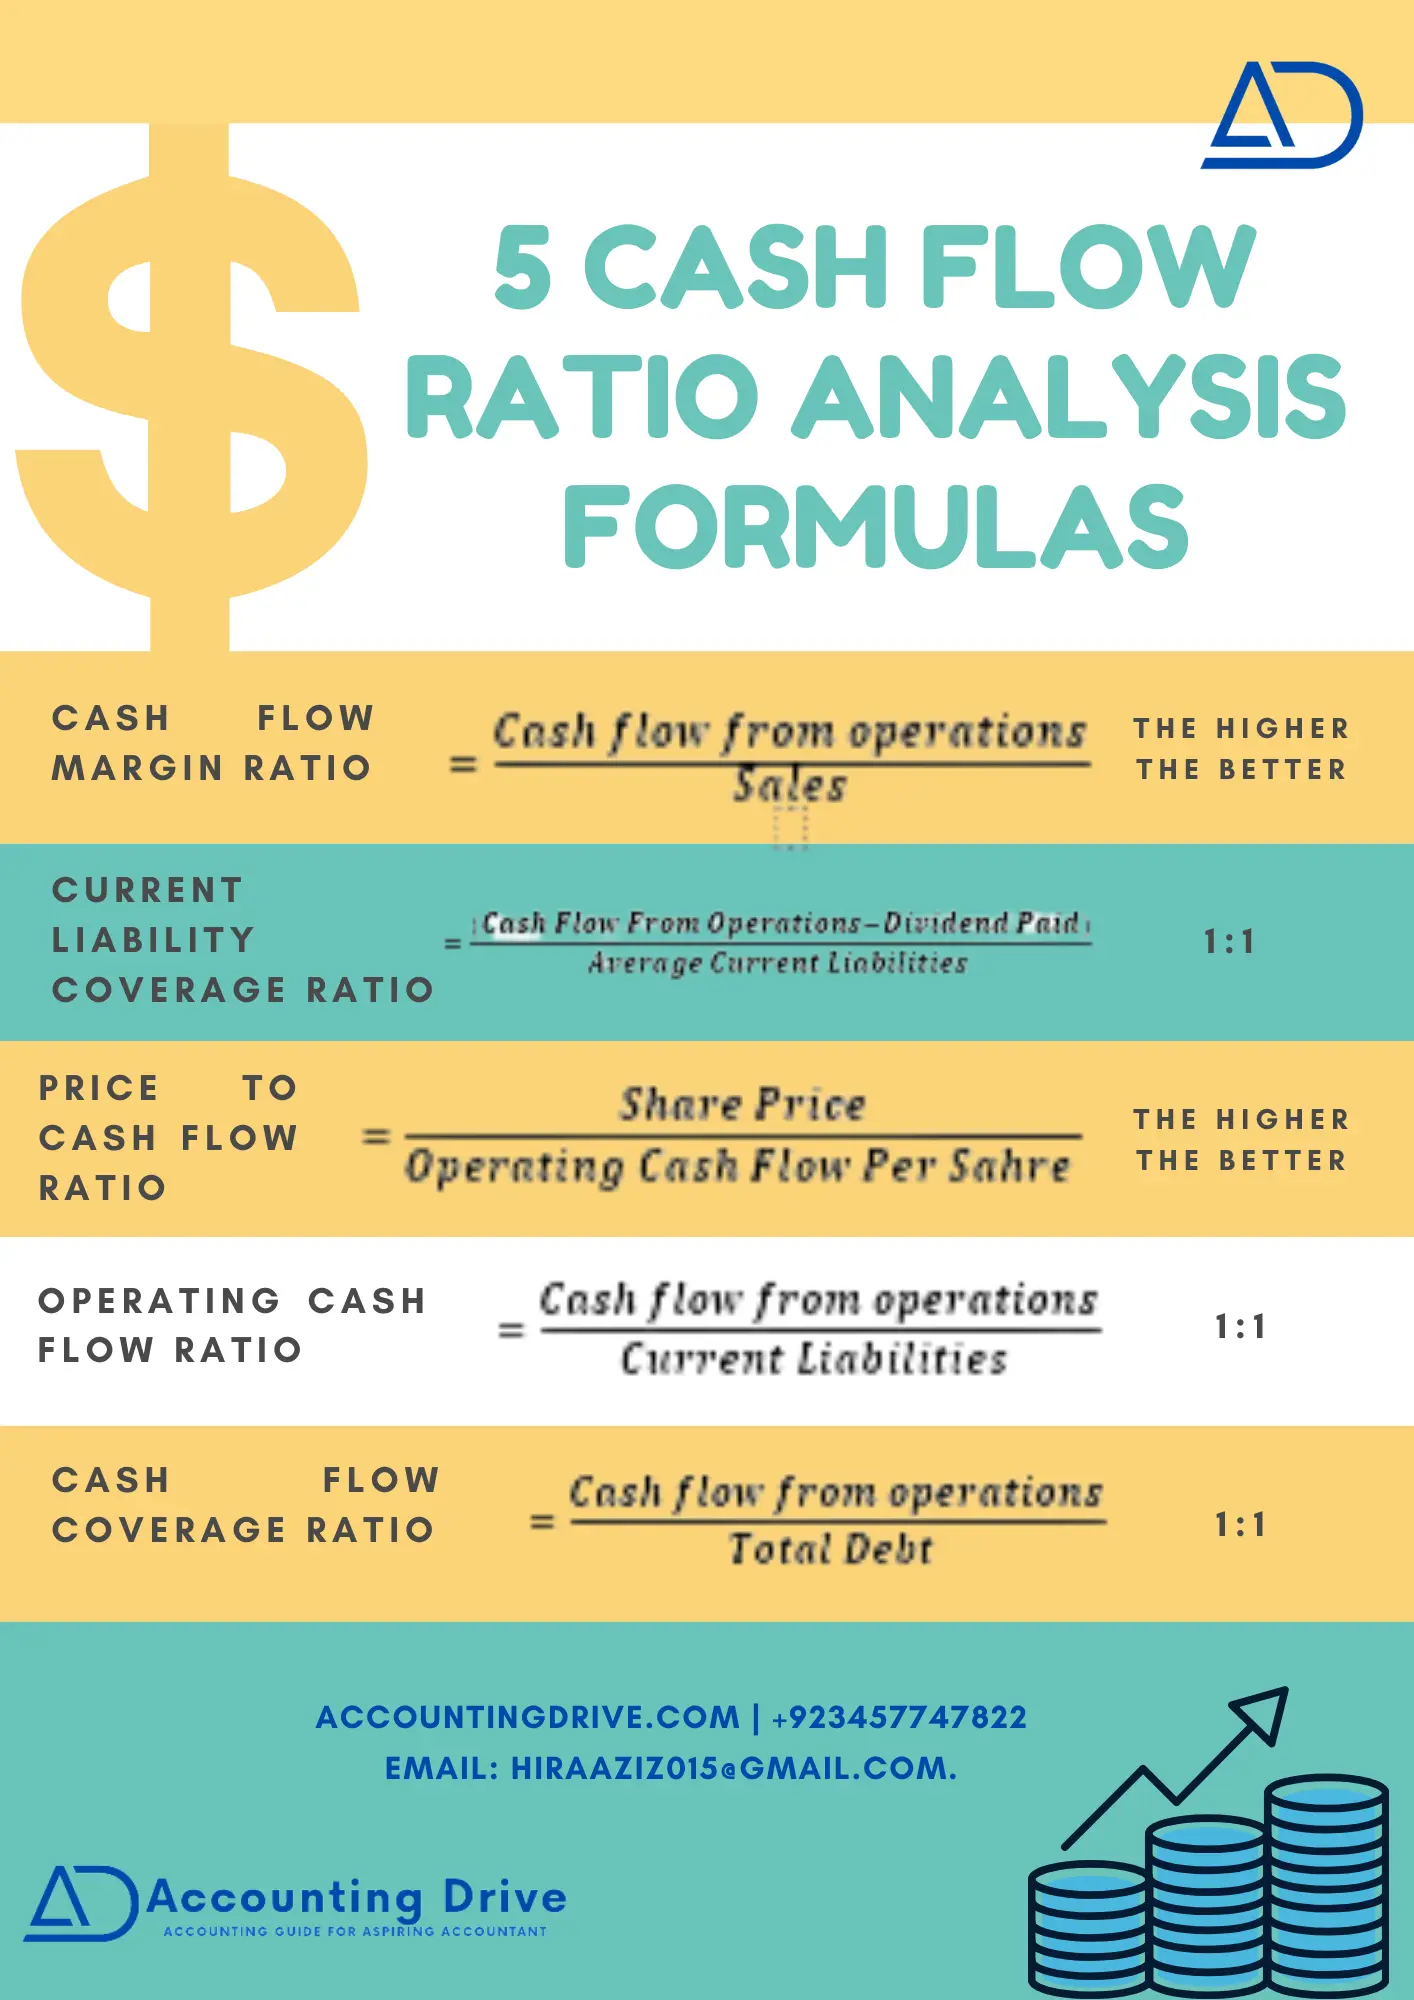
Cash Flow Margin Ratio
Cash Flow Margin Ratio = Cash flow from operations / sales
Cash flow from operating activities can be measured as:
Net Income + Non-cash Expenses (Dep & Amortization) + Change in Working Capital
2. Current Liability Coverage Ratio
It can be calculated by dividing the cash flows from operations from current liabilities. Therefore, it indicates that if this ratio results in less than 1:1, it means that the business is not producing sufficient cash to pay for its immediate/current obligations, which causes a significant risk of bankruptcy.
Current Liability Coverage Ratio
Current Liability Coverage Ratio = (Cash flow from operations – Dividend paid) / average current liabilities
| For Example, firstly if the Current Liability Coverage Ratio > 1:1 | Then, the company is in a good position to pay off its current liabilities. |
| Secondly, if the Current Liability Coverage Ratio = 1:1 | In short, it has sufficient cash to pay off its current liabilities. |
| Thirdly, if the Current Liability Coverage Ratio < 1:1 | then, the company does have not sufficient cash to pay off its current liabilities. |
3. Price to Cash Flow Ratio
Meanwhile, you may calculate the Price to cash flow ratio by dividing the company’s share price by the operating cash flow per share of stock.
Price to Cash Flow Ratio
Price to Cash Flow Ratio = Share price/ operating cash flow per share*
Now here, you may consider that a lower price to cash flow is ideal; it shows that the value of the share will most likely increase. Moreover, you can also take it like that although the stock prices aren’t much, the organization can help itself through the current cash flow.
4. Operating Cash Flow Ratio
The operating cash flow ratio helps to calculate how well its operating cash flow covers the company’s current financial debt. Because if it’s more than one, then it means an entity has enough money for its operations.
Operating Cash Flow Ratio
Operating cash flow ratio = Cash flow from operations / current liabilities
With the help of using this ratio, you can assist and gauge a company’s liquidity for a short time period.
5. Cash Flow Coverage Ratio
You can calculate it by dividing operating cash flows divided to total debt. Most importantly, this ratio needs to be high, as a result, an entity may have enough cash flow to pay for the principal as well as interest installments on its debt on time.
Cash Flow Coverage Ratio
Cash Flow Coverage Ratio = Cash flow from operations / total debt
Furthermore, in most scenarios, you must find that cash flow ratios are the best tool to measure an entity’s liquidity, solvency, & long-term viability of an entity. So, Cash flow ratios are very crucial for the financial analysis of every business.
Cash Flow Analysis Ratios Example
Firstly, to understand the ratios completely, let’s take a small data of an XYZ company and then calculate ratios by this information. Assuming company, XYZ recorded the following info for 2020 & 2019 business activities:
| 2020 | 2019 | |
| Sales | $6,300,000 | $6,000,000 |
| Depreciation | $110,000 | $100,000 |
| Amortization | $120,000 | $120,000 |
| Non-cash expenses | $45,000 | $50,000 |
| Working capital | $1,400,000 | $1,000,000 |
| Current assets | $2,400,000 | $2,000,000 |
| Current Liabilities | $1,000,000 | $1,000,000 |
| Total debt | $2,500,000 | $2,500,000 |
| Net income | $3,100,000 | $4,000,000 |
| Share capital | $10,000,000 | $10,000,000 |
| No. of shares | 500,000 | 500,000 |
| Share price | $20 | $20 |
| Dividend Paid | $0.5 per share | $0.5 per share |
Cash Flow Ratio Analysis Calculation
Operating Cash Flow Margin
To calculate this ratio, Firstly you have to calculate the cash flow generated from operating activities. So, you can calculate it as: Cash flow generated from operating activities for the year 2020 is = $3,100,000 + ($110,000 + $120,000 + $45,000) + ($1,400,000 – $1,000,000) = $3,775,000
Hence the operating cash flow margin is calculated as:
Operating cash flow margin = $3,775,000 / $6,300,000 = 59.9%
Thus, the higher the percentage, means the more cash is available from sales to pay as a dividend, for suppliers, utilities, and to buy capital assets.
Current Liability Coverage Ratio
If we can take the above data to calculate the current liability coverage ratio, then the Current liability coverage ratio can be calculated as:
Current liability coverage ratio = ($3,775,000 – 250,000) / $1,000,000 = 3.525
Hence, it indicates that the organization has sufficient cash to pay its current liabilities.
Price to Cash Flow Ratio
After that, to calculate the Price to Cash Flow ratio, first, you have to calculate the operating cash flow per share. So simply, you can calculate it by dividing the operating cash flow by the number of total shares.
*Operating cash flow per share = $3,775,000 / 500,000 = $7.5
, Price to Cash Flow Ratio = $20 / $7.5 = $2.67
So, the answer is $2.67, which indicates that investors pay $2.67 for each dollar of cash flow.
Operating Cash Flow Ratio
Furthermore, the operating cash flow ratio is calculated as
Operating cash flow ratio = $3,775,000 / $1,000,000 = $3.775
Cash Flow Coverage Ratio
For calculating the cash flow coverage ratio, you have to go deep down a little more.
For example, a company XYZ wants a loan, and the bank’s credit analyst look at the coverage ratio to determine the creditworthiness & its ability to repay the loan. To calculate the ratio, they will go through the statement of cash flows and get last year’s operating cash flows amount of $3,775,000, and the year’s total debt payable was $2,500,000.
Cash flow coverage ratio: $3,775,000 / $2,500,000 = 1.51
Interpretation of Cash Flow Analysis Ratios
By seeing the results, credit analysts may say that the company is able to produce enough cash flow than what is required to cover its existing obligations. Hence, the operating cash flow ratio figure of $3.775 is a good indicator of how readily and easily current liabilities are offset by the cash flows generated from XYZ’s company’s operations. The good operating cash flow ratio is always equal to or higher than 1:1. The ratios give traders, creditors, and other stakeholders a broad view of the company’s operating efficiency. Thus, an organization with huge cash flow ratios is usually known as cash cows, with apparently endless amounts of money to do whatever they like.
Key Points
- To sum up, the calculation of cash flow ratios will give you a clear picture of the accurate cash position of an entity.
- So, Cash flow ratios are the best tool to measure an entity’s liquidity, solvency, & long-term viability of an entity.
- Hence, each ratio exhibits a certain financial aspect of an organization.
- The good operating cash flow ratio is always equal to or higher than 1:1.